Cherry-picking statistics is all the rage, at least insofar as it makes anyone’s favourite player look good. Since it’s the international break, let’s pick a few cherries and throw them at Chelsea-loving passers-by.
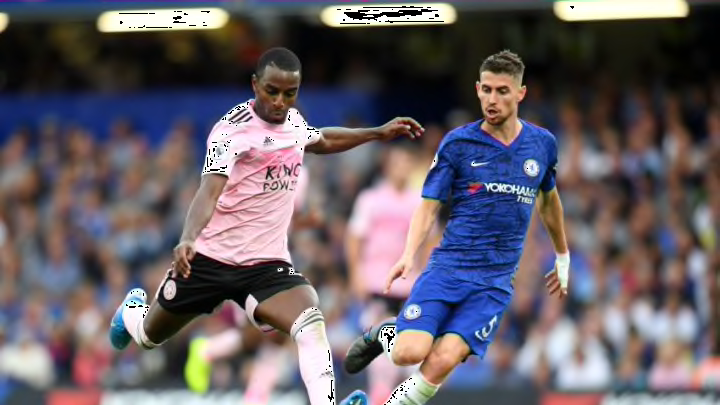
That Jorginho, what a player. Maurizio Sarri supposedly weakened Chelsea’s defensive structure by using N’Golo Kante as a box-to-box midfielder in favour of Jorginho at the base of a midfield three. Weakened the defence? More like Jorginho had the second most tackles on the team last season, a perch he continues to hold this season. Only Cesar Azpilicueta wins more, and this season Jorginho has attempted even more tackles than the full-back.
No wonder Jorginho is winning over Chelsea fans as readily as he wins tackles. And since Jorginho won about 60% of his tackles in both seasons, at this rate he only has to Zeno’s Paradox himself over another 16% or so of the Blues’ faithful.
That seems optimistic.
See, that’s the thing. Jorginho has won a lot of tackles because he goes in for a lot of tackles, but he doesn’t win them at a particularly convincing rate. Azpilicueta won 78% and 73% of his tackles last season and this season, respectively.
Kante was in the mid-60’s for his tackle win rate for his two seasons playing forward of Jorginho. That’s about what he did under Antonio Conte in 2017/18, but a pretty big drop from 2016/17’s 73% tackle win rate. Additionally, those two seasons involved Kante doing more defending in a more critical position with Chelsea as a whole doing more defending in deeper positions, per Conte’s approach.
Jorginho once had a season with a Kante-esque tackling rate. His best tackling season came in 2016/17 when he won 65% of his tackles. Pretty impressive, right?
Well, that was the one season Napoli finished third instead of second under Maurizio Sarri. And Napoli conceded more goals that season than any other of Sarri’s time there: 39. Coincidence of coincidences, that’s the same amount Chelsea conceded last season under Maurizio Sarri.
Napoli’s nadir season of 2016/17 season was also Jorginho’s best for involving himself in plays that actually developed into something.
Per SmarterScout, Jorginho was involved in 65% of moves resulting in a goal (for his own team, not the opponent – you know you were thinking it), 57% of moves ending in a shot and 54% of Napoli’s expected goals (xG). Last season at Chelsea, overseeing the on-pitch xenotransplantation of Sarriball to the Premier League, Jorginho’s latter two stats were his lowest of a domestic league campaign.
That’s a pretty mixed picture. Is Jorginho best defensively when his team is at their worst defensively? Or is he at his best offensively when his team is at their best defensively (Napoli scored their most goals under Sarri in that same season when they conceded the most and finished third)? Maybe, since he’s the midfield general, as Jorginho goes, so goes the rest of the team. Or since he’s a rigidly passive traveller, as the team goes, so goes he. But when too much of the defending falls on his narrow shoulders, the team ships goals liberally and slips down the table.
What’s the point of all this? Am I just trying to illustrate how 59% of people know that stats can be used to prove anything?
No, merely that football stats without a lot of context – much of which cannot be described quantitatively – are just numerical decorations, the ingredients of sound bites and social-shareable graphics.
Since we’re talking tackles, Emerson has not been dribbled past all season. He is 18 for 18 attempted tackles. Is that because he is such an imperious defender that no one can get past him, or is it because more attacks come down Chelsea’s right than Chelsea’s left?
Well, Marcos Alonso attempted 20 tackles in roughly the same amount of minutes, and Cesar Azpilicueta playing mostly on the right has attempted 38 tackles: precisely Alonso’s plus Emerson’s. Does that mean opponent’s attacks are completely balanced? Probably not, because Willian has attempted 32 tackles, the fourth-most on the team, while playing mainly at right wing. Is Willian making so many more tackles from advanced positions because Azpilicueta is the more defensive full-back? And if so, shouldn’t Emerson – the most attacking of the lot, we’re told – be picking up more in forward positions on the other side?
Maybe he is. Perhaps Emerson hasn’t lost a tackle all season because he’s making relatively easy tackles against the opponent’s full-backs deep in their half. Maybe he is so far out of position due to his well-documented failure to track back that he does not go into as many tackles against the opponent’s forwards.
For all we know, he may have attempted 18 easy tackles whereas Marcos Alonso and Cesar Azpilicueta are making the more difficult and more crucial tackles against more potent players, resulting in their occasional misses.
No, really, what’s the point of all this? The stats that do the rounds raise more questions than they answer for anyone willing to interrogate them ever so gently. Unless you swallow them whole with absolutely no thought, they provide very little. Those that show even an introductory amount of necessary context cost more than you and I are willing to pay. But even those fail to capture why things happen as they do.
For that, you have to watch the games. Find the context. Figure out why the numbers on WhoScored are what they are. Look beyond the two seconds of the one-on-one battle that finds its way to a spreadsheet column somewhere.
As we’ve done here, each additional datum and probe raises dozen of potential scenarios and explanations for what was superficially an open-and-shut case. It’s worth understanding why.
